Tuition and fees still rising faster than aid, College Board report shows
Net Price Keeps Creeping Up
Tuition and fees increased by a few percentage points across the board, and aid failed to keep pace, annual College Board report shows.
October 25, 2017
Tuition and fees increased by less than 2 percent between 2016-17 and 2017-18 after adjusting for inflation, according to new College Board reports released Wednesday. The reports, “Trends in Student Aid” and “Trends in College Pricing,” are released annually, showing both short-term changes and trends over longer periods of time.
Private nonprofit four-year institutions’ average published tuition and fees increased by 1.9 percent, to $34,740, in 2017-18, after adjusting for inflation. Public four-year institutions’ tuition and fees rose by 1.3 percent, to $9,970. Public two-year colleges’ tuition and fees increased by 1.1 percent year over year, to $3,570.
The increases are significant, but they are substantially lower than year-over-year jumps seen during the Great Recession. In 2009-10, when institutions posted some of their largest tuition increases, private nonprofit four-year institutions raised tuition and fees by 5.9 percent. Public four-year colleges posted a 9.5 percent increase, and public two-year colleges posted a 10.2 percent hike.
Yet the prices students end up paying in tuition and fees still marched upward in 2017-18 as grant aid and tax benefits did not keep pace with rising sticker prices. That’s a key difference from the recession. Then, average net prices declined despite jumps in published tuition and fees because of major increases in grant aid and tax benefits, the reports say.
Now, net prices for full-time students at public four-year institutions have increased for eight straight years, for seven straight years for students at public two-year colleges, and for six straight years for those at private nonprofit colleges and universities. So the typical student keeps paying more for college each year.
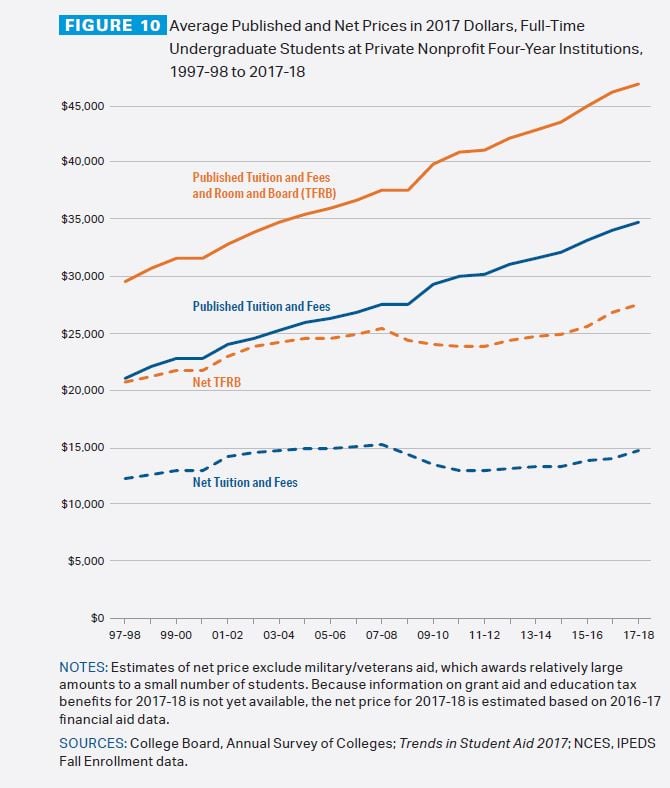
Across private nonprofit four-year institutions, net tuition and fees collected per full-time undergraduate student averaged $14,530 in 2017-18. That was up from $13,890 the year before, meaning net tuition and fees increased by a substantial 4.6 percent. At public four-year colleges, net tuition and fees averaged $4,140, up from $4,010, an increase of 3.2 percent.
At public two-year colleges, grant aid and tax benefits exceeded posted tuition and fees. But students were still expected to pay more than in recent years. In 2017-18, the average aid and tax benefits totaled $330 more than the cost of tuition and fees. In 2016-17, it was $370 more than tuition and fees. Average aid can exceed average net tuition and fees — students still must fund other expenses, like housing, food and books, which can cost thousands of dollars.
Increases in colleges’ sticker prices and net prices aren’t just numbers on paper. They drive questions about the affordability of higher education for many families. They also cause some to question the value of attending a college or university, as higher up-front costs make some worry about the return on investment. The debate exists even as research continues to point to strong economic benefits from earning a college education.
Prices creeping up year after year is a serious problem, said Sandy Baum, a senior fellow at the Urban Institute, who co-wrote the report.
“We should be thinking about it not as a one-year problem, but as a long-term question of how we’re going to finance higher education,” she said.
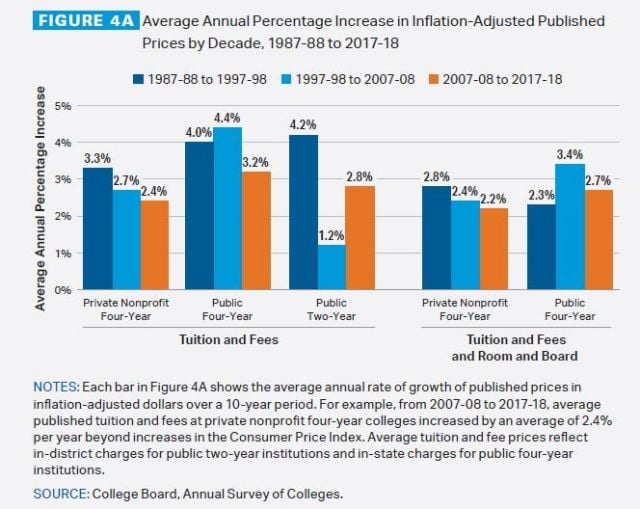
In the decade from 2007-08 to 2017-18, published prices rose by an average of 2.4 percent annually at private nonprofit four-year institutions, after adjusting for inflation. They rose by 3.2 percent annually at public four-year institutions and by 2.8 percent at public two-year institutions.
Seemingly small annual increases can add up over decades. The published tuition and fee price in the public four-year sector was 3.13 times higher in 2017-18 than it was in 1987-88. The tuition and fee price in the private nonprofit four-year sector was 2.29 times higher in 2017-18 than it was 30 years earlier. The price in the public two-year sector was 2.25 times higher.
Examining net pricing trends over the last decade shows two general periods of change. Generally, net tuition and fees dropped after 2007-08 and started to rebound in subsequent years.
In the four-year private nonprofit sector, for example, net undergraduate tuition and fees fell from an average of $15,270 in 2007-08 to $13,210 in 2012-13. In other words, net tuition and fees are currently lower, at $14,530, than they were in 2007-08, but significantly higher than they were in 2013-14.
In the public two-year sector, net tuition and fees fell from $350 in 2007-08 to negative $620 in 2012-13. At negative $330, average net tuition and fees are currently still lower than they were in 2007-08 but come in higher than they were in 2012-13.
Public four-year institutions are slightly different because net tuition and fees are higher today than they were a decade ago. In 2007-08, net tuition and fees for full-time in-state undergraduate students at public four-year institutions were $3,070. They fell, notching $3,460 in 2012-13, and have since climbed back to more than $4,100.
Those changes came amid some differing trends in enrollment and public funding for higher education. From 2005-06 to 2010-11, enrollment jumped by 19 percent, while total state and local funding rose by just 2 percent. As a result, per-student funding fell by 14 percent.
Then from 2010-11 to 2015-16, total state and local funding fell by 2 percent. But enrollment dropped by 5 percent, leading to a 3 percent increase in per-student funding.
Financial Aid
Grant aid for postsecondary students totaled $125.4 billion in 2016-17. That was 74 percent more than 10 years earlier, adjusting for inflation.
Full-time-equivalent enrollment increased by 11 percent during that time frame. That left grant aid per undergraduate rising by 61 percent, to $8,440, and grant aid per graduate student increasing by 39 percent, to $9,290.
Colleges and universities are shouldering more of the grant load. The federal share of grant aid topped out at 44 percent in 2010-11 and has since dropped to 32 percent in 2016-17. Institutional grant aid rose from 35 percent to 47 percent during that same time frame.
Expenditures on Pell Grants increased from $15.2 billion in 2006-07 to $35.8 billion in 2011-12, then dropped to $26.6 billion in 2016-17. The number of Pell Grant recipients has fallen for five straight years but at 7.1 million recipients is still 38 percent higher than it was in 2006-07.
Meanwhile, the makeup of federal grant aid has skewed more heavily toward veterans. Pell Grants fell from 76 percent of federal grants in 2006-07 to 66 percent of federal grants in 2016-17, even as they grew in dollar terms. Veterans’ benefits increased from $3.2 billion to $12.9 billion during the same time frame, rising from 16 percent to 32 percent of all federal grants. The recent Forever GI Bill will reinforce the trend, according to the reports.
Grant aid per full-time-equivalent undergraduate student increased by 14 percent, or $1,020, between 2011-12 and 2016-17. It had increased by 42 percent, or $2,180, in the previous five years.
Both low-income and high-income families received more tax credits in the years between 2004 and 2014. The share of savings from education tax credits and deductions for households with adjusted gross income of less than $25,000 was 15 percent in 2004. It rose to 24 percent in 2014.
The share of savings from education tax credits and deductions for households with adjusted gross income of $100,000 went from 0 percent to 24 percent during the same time span. The American Opportunity Tax Credit, implemented in 2009, shifted the benefits of education tax credits toward upper-income and lower-income filers, according to the reports.
Nearly two-thirds of bachelor’s degree recipients from public and private nonprofit institutions borrowed — 60 percent. They graduated with an average of $28,400 in debt. In 2017, half of outstanding federal education loan debt is held by just 12 percent of borrowers who owe $60,000 or more. Another 57 percent of borrowers with outstanding federal education loan debt owe less than $20,000.
Total annual education borrowing dropped for the sixth consecutive year. It fell by 15 percent, from $125.6 billion in 2010-11 to $106.5 billion in 2016-17, adjusting for inflation. Borrowing per full-time-equivalent undergraduate decreased by $830, to $5,430.
Borrowing per undergraduate has likely fallen for multiple reasons, Baum said. The improved economy likely means more parents have jobs and can pay more for their children to go to college. Some students might also be going to work instead of college.
Borrowing per graduate student has followed a different path. It first decreased, from $19,420 in 2010-11 to $17,760 in 2014-15. Then it rose to $18,430 in 2016-17.
“Graduate students can borrow a virtually unlimited amount under the Grad PLUS program, and as tuition goes up, they just borrow more,” Baum said. “It’s time to think hard about the structure of federal loans for graduate students.”
Financial aid per undergraduate full-time-equivalent student averaged $14,400 in 2016-17. Grants from various sources accounted for $8,440, federal loans were $4,620, education tax credits and deductions were $1,280, and Federal Work-Study averaged $60.
Graduate students received $27,950 per full-time equivalent in financial aid. Federal loans averaged the largest share, at $17,710, followed by grants at $9,290, tax credits and deductions at $860, and Federal Work-Study at $90.


.JPG)
.JPG)
.JPG)